
Stop Using DCFs
How I moved to an instant valuation tool

In the first half of 2021, I built an articulated DCF model like many investors do.
And although it was pretty complex and a bit boring too, I felt ready to take objective, data driven decisions.
But as long-time readers may know, I soon decided to pause it.
In fact:
❌ Everything looked super expensive;
❌ I was pretty unsure about the inputs of the Terminal Value, an element of massive importance inside the model;
❌ When the DCF was signalling a potential opportunity, it was in reality a value trap or a deteriorating business…
❌ It just did-not-work!
Let me share today how this has evolved over time for me.
Because I’ll be introducing you to with a new tool which is saving me hours and it’s incredibly fun to use!
🚀 Stay until the end!
Why standard DCFs don’t work
Be honest: when was the last time you found an asymmetric opportunity with this old-shool methodology?
I’ll be short, but there are 3 massive reasons why this approach has never worked for me.
I know some Wealth Managers, or Investment Analysts reading this (thanks for reading me if it’s you!) will roll their eyes… but here they are:
1️⃣ ‘Fair Value’ does not exist
It’s an illusion. Markets live in the future, and are not fair!
I quickly learnt to accept the idea of stocks constantly being either overvalued or undervalued.
My goal is not to find a specific price point, but a range of possibilities which is skewed towards the upside, with an enourmous amount of uncertainty to factor in.
2️⃣ Terminal Value messes everything up
TV impacts 70-80% of the final outcome.
But it’s based on too generic assumptions (terminal growth rate above all) which by the way completely exclude market sentiment from the equation.
3️⃣ Valuation should never finalize the decision, but only filter it
I’ve seen this so many times.
Beginner investors calculating a fair point, slashing a -30% margin of safety on it, done.
Buy.
…it’s just not how it works.
It was like racing a F1 race with a horse.
2 ‘moments of epiphany’
Two fundamental shifts saved me from many more mistakes and allowed me to start building a comprehensive investing system that blends multiple quantitative and qualitative elements.
1️⃣ From DCF to Sentiment-adjusted Reverse DCF
Moving to a Reverse DCF was a first step: I started stress-testing what companies needed to achieve in order to justify my own desired return, instead of the opposite (what return do I get if the company grows X?).
But it was not enough.
I eliminated the TV issue replacing it with a deep research on what determines exit multiples.
Inside my training program I’ve got hours of recordings about this, so I’ll leave it for another episode.
But in essence: I adapted my valuation tecnique to how the market thinks (based on my research).
2️⃣ Valuation as filter, not verdict
I stopped letting valaution be the leading dog of the process.
Instead of having them finalize my decision, I put this part earlier in the process to only skim options faster.
What it means concretely (example of my weekly routine):
If nowadays the Idea Generation OS Master Archive gives me 400-500 names at a time, I use a horizontal Reverse DCF logic that scrapes inside it to filter out everything to come down to a top 20% of my investable universe which seems compelling valuation wise as well.
(PS: Idea Gen OS is available to you with a premium subscription).
But there’s more.
I told you about a new tool in the intro.
This tool now allows me to run instant reverse DCF checks for any company, on scale!
Meet Expectation Pulse™
A new tool I’ve built to accelerate my research and make it more fun.
It’s not trained with ChatGPT or any other AI slop.
I simply trained it with my own mechanisms, slides, video transcripts, and rules.
➡️ If it sounds helpful, message me “PULSE” and I’ll share a free seat!
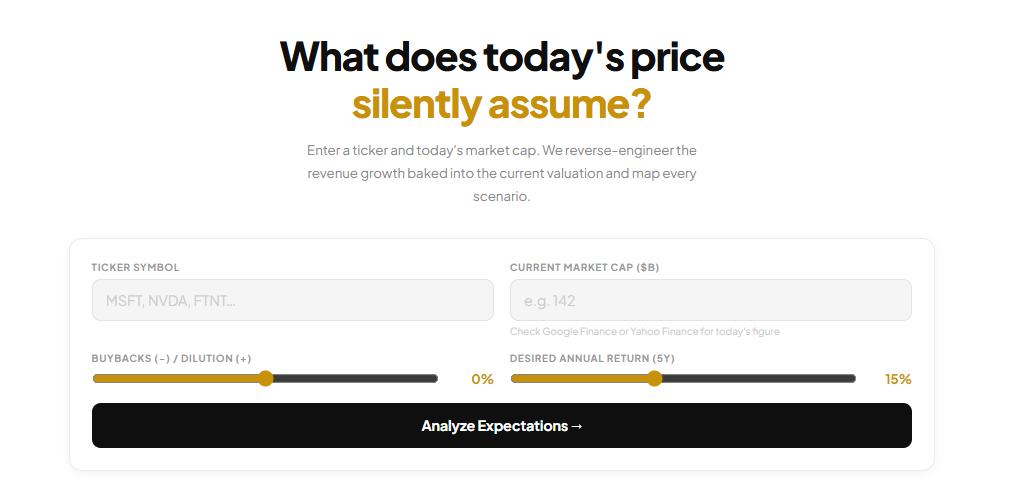
How does it work? It’s pretty simple:
input your ticker symbol
the market cap
your desired return
ad adjustment of the expected net dilution or buyback effect
Done.
I always run it at 15%.
But running it at 8-10% tells you something equally useful: what the market itself is pricing in today.
The output is a matrix.
(together with a brief commentary of what emerges from it).
X axis → the expected marginality based on the type of company and its life cycle we’re dealing with
Y axis → simulations of possible exit multiples
So each inquiry answers the same question:
for these combinations of exit multiples and marginalities, what revenue CAGR does this company need to deliver to make my target return possible on paper?
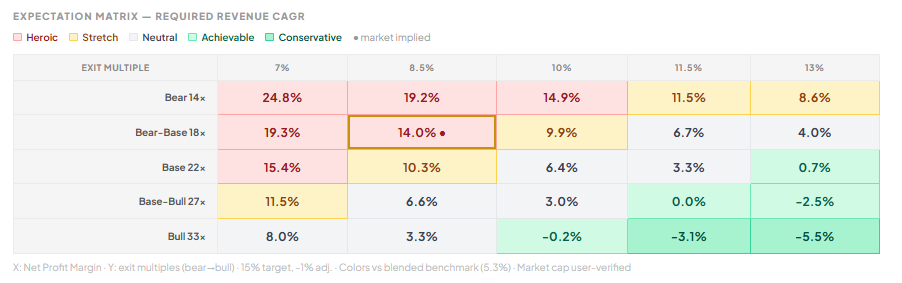
The colors complete the view:
🔴 Red = too much revenue growth required.
For Nike, an example, we see a lot of red.
That’s because the requirement exceeds what the company has historically delivered, and exceeds what even optimistic analysts project.
🟢 Green = required growth seems achievable based on trajectory and forward context.
The agent is still too optimistic sometimes (we can see it with the marginality of Nike: right now it’s fallen way below 10%).
But still… a solid (and immediate) starting point!
The usual disclaimers
⚠️ AI is for speed, not lazy verdicts. Challenge the output. Don’t accept it as-is.
⚠️ An attractive matrix might hide execution or business risks. Vice-versa, a matrix with lots of red may signal the market’s enthusiasm for a certain name. Get used to false signals!
⚠️ Attractive valuations can bring value traps to your table! I know this personally, see above. It’s your job to spot them as you move further into the process.
⚠️ This will never be financial advice.
Why I’m doing this
The question would be fair to ask.
Well, the answer is that ever since I started this value investing journey, I’ve always found a lot of energy in trying to simplify things.
In building systems. Logic flows.
Turning something complex into something which is easy to digest has always motivated me as a person, also outside the investing world.
I’m sure this will resonate if you’re also a ‘creative-engineer person’ like me.
Put it this way:
If I can help you with a full in-depth analysis of a quality company, it’s great.
But If I can give yout tools to scratch the surface of ANY company, so that you get the 80/20 fast, that would be fantastic.
Ps: I’ve wondered why I became pretty obsessed with true crime recently… but then someone told me that ‘as usual, you’re trying to make sense of incomplete information’ - like I do with investing. True!

That’s it for today.
Remember to write me “Pulse” if you want to test this tool.
Thank you again for your time.
📈
Happy Investing,
Francesco
This way ok:
.
https://substack.com/@absolutetotalcompound/note/c-245235501?r=5g11d4